The vote for Congress
Latest field date: Oct 4, 2026
The newest qualifying poll is 18 days old.
Latest nonpartisan poll per pollster, past 120 days. Equal-weight average, not a forecast.
The races for Congress, the latest polls, and the dates voters need.
Current officeholders: official public portraits. Additional candidate photographs: Mary Peltola, archival congressional portrait. U.S. Congress Biographical Directory.; Sherrod Brown, archival congressional portrait. U.S. Congress Biographical Directory.; Mike Rogers of Michigan, archival congressional portrait. U.S. Congress Biographical Directory.; Abdul El-Sayed campaign photograph, Abdul for Senate.; Roy Cooper, NCDOTcommunications (2018), cropped version from Wikimedia Commons. CC BY 2.0; Michael Whatley, Gage Skidmore (2024), crop by TaurusEmerald via Wikimedia Commons. CC BY-SA 2.0; James Talarico, photo by Larry D. Moore, via Wikimedia Commons. CC BY 4.0; Ken Paxton, photo by Gage Skidmore, via Wikimedia Commons. CC BY-SA 2.0; Troy Jackson, photo by ArenLeBrun, via Wikimedia Commons.; Angie Nixon, photo by Florida House of Representatives, via Wikimedia Commons.; Todd Achilles, photo by DL a.k.a. LibertyDad, via Wikimedia Commons. CC BY 4.0; Kurt Alme, photo by United States Department of Justice, via Wikimedia Commons.; Seth Bodnar, photo by Todd Goodrich, via Wikimedia Commons. CC BY-SA 4.0; Hallie Shoffner, photo by Ark. Agricultural Experiment Station, via Wikimedia Commons. CC BY-SA 4.0; Bert Mizusawa, photo by U.S. Army, via Wikimedia Commons.; John Deaton, photo by Jeff Dranetz, via Wikimedia Commons. CC BY 3.0; Vivek Ramaswamy, photo by Gage Skidmore, via Wikimedia Commons. CC BY-SA 4.0; Amy Acton, photo by United States Air Force, via Wikimedia Commons.; Keisha Lance Bottoms, photo by Senate Democrats, via Wikimedia Commons. CC BY 2.0; Christine Drazan, photo by Oregon State University, via Wikimedia Commons. CC BY-SA 2.0; David Jolly, photo by U.S. House of Representatives, via Wikimedia Commons.; Gina Hinojosa, photo by RRC1701, via Wikimedia Commons.; David Crowley, photo by LaShawnda Jones, via Wikimedia Commons. CC BY-SA 4.0; Rob Sand, photo by Rob Sand for Iowa, via Wikimedia Commons.; Zach Lahn, photo by Aunger67, via Wikimedia Commons.; Lisa Demuth, photo by Lisa Demuth for Governor, via Wikimedia Commons.; Amanda Janoo, photo by Town Meeting TV, via Wikimedia Commons. CC BY 4.0; Hannah Pingree, photo by Hannah Pingree for Governor, via Wikimedia Commons. CC BY 4.0; Jerri Green, photo by Zach Kinslow, via Wikimedia Commons. CC BY 4.0; Deb Haaland, photo by Department of the Interior, via Wikimedia Commons.; Ryan Fazio, photo by James Naleski, via Wikimedia Commons. CC BY-SA 4.0; Xavier Becerra, photo by Office of the Attorney General of California, via Wikimedia Commons.; Steve Hilton, photo by Gage Skidmore, via Wikimedia Commons. CC BY 2.0; Marni von Wilpert, photo by City of San Diego, via Wikimedia Commons.; Jim Desmond, photo by County of San Diego, via Wikimedia Commons.; Chris Jones, photo by BloodshotRollinRed This image has an extracted file : Chris , via Wikimedia Commons. CC BY-SA 4.0; Richard Pan, photo by Dr. Richard Pan from Sacramento, CA, USA, via Wikimedia Commons. CC BY-SA 2.0; Cait Conley, photo by DHSgov, via Wikimedia Commons.; Tano Tijerina, photo by E. R. Softwood, via Wikimedia Commons. CC BY-SA 4.0; Lily Tang Williams, photo by AI News, via Wikimedia Commons. CC BY 3.0; Maura Healy, photo by Zgreenblatt, via Wikimedia Commons. CC BY-SA 3.0; Rick Jackson, photo by Cherie Martin, via Wikimedia Commons. CC BY 4.0; John E. Sununu, official U.S. Senate portrait, via Wikimedia Commons.; Jocelyn Benson, photo by Ariel Weis, via Wikimedia Commons.; Doug Jones, photo by Office of Nomination Advisor for Legislative Affairs Doug Jo, via Wikimedia Commons.
Latest field date: Oct 4, 2026
The newest qualifying poll is 18 days old.
Latest nonpartisan poll per pollster, past 120 days. Equal-weight average, not a forecast.
Latest field date: Oct 6, 2026
The newest qualifying poll is 16 days old.
Latest nonpartisan poll per pollster, past 120 days. Polls differ in sample and method.
| Pollster | Field date | Sample | Result |
|---|---|---|---|
| Pew Research Center ↗ | Oct 4, 2026 | 3,917 registered voters | Dem 44% · Rep 36% |
| YouGov - CBS News ↗ | Oct 2, 2026 | 1,572 likely voters | Dem 54% · Rep 45% |
| HarrisX/Harris ↗ | Sep 28, 2026 | — likely voters | Dem 51% · Rep 49% |
| The Argument/Verasight ↗ | Sep 22, 2026 | — likely voters | Dem 55% · Rep 45% |
| YouGov ↗ | Sep 8, 2026 | 1,015 likely voters | Dem 49% · Rep 38% |
| Morning Consult ↗ | Sep 6, 2026 | 2,203 registered voters | Dem 46% · Rep 42% |
| Ipsos ↗ | Aug 24, 2026 | 951 registered voters | Dem 41% · Rep 35% |
| Noble Predictive Insights ↗ | Aug 16, 2026 | 2,533 registered voters | Dem 47% · Rep 42% |
| Pollster | Field date | Sample | Result |
|---|---|---|---|
| RMG Research ↗ | Oct 6, 2026 | 2,000 registered voters | Approve 43% · Disapprove 56% |
| Pew Research Center ↗ | Oct 4, 2026 | 5,062 adults | Approve 30% · Disapprove 68% |
| TIPP Insights ↗ | Aug 28, 2026 | 1,461 adults | Approve 38% · Not Sure 10% |
| Ipsos ↗ | Aug 24, 2026 | 951 registered voters | Approve 37% · Disapprove 63% |
| YouGov ↗ | Aug 24, 2026 | 1,379 registered voters | Approve 40% · Disapprove 57% |
| Noble Predictive Insights ↗ | Aug 16, 2026 | 2,533 registered voters | Approve 42% · Disapprove 56% |
| Big Data Poll ↗ | Jun 28, 2026 | 2,604 likely voters | Approve 44.4% · Disapprove 53.3% |
Polling data via VoteHub Polling API, licensed CC BY 4.0. The Baseline computes the simple displayed averages; VoteHub does not endorse them.
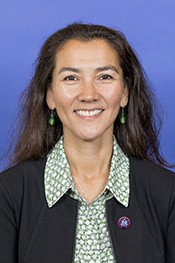 Mary Peltola (D)48.8
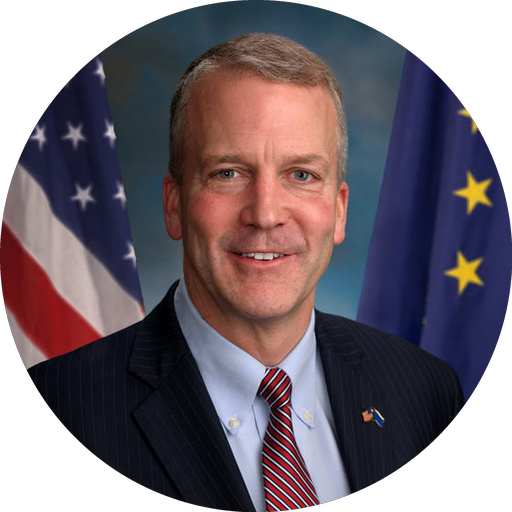 Dan Sullivan (R)48.2
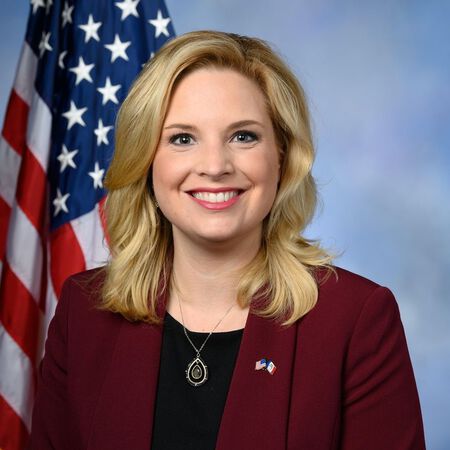 Ashley Hinson (R)46.3
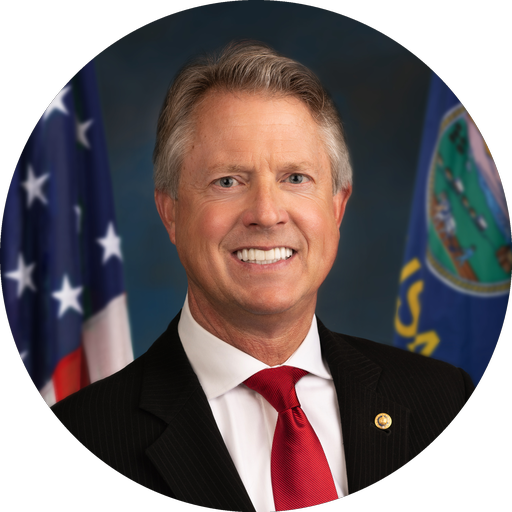 Roger Marshall (R)46.3
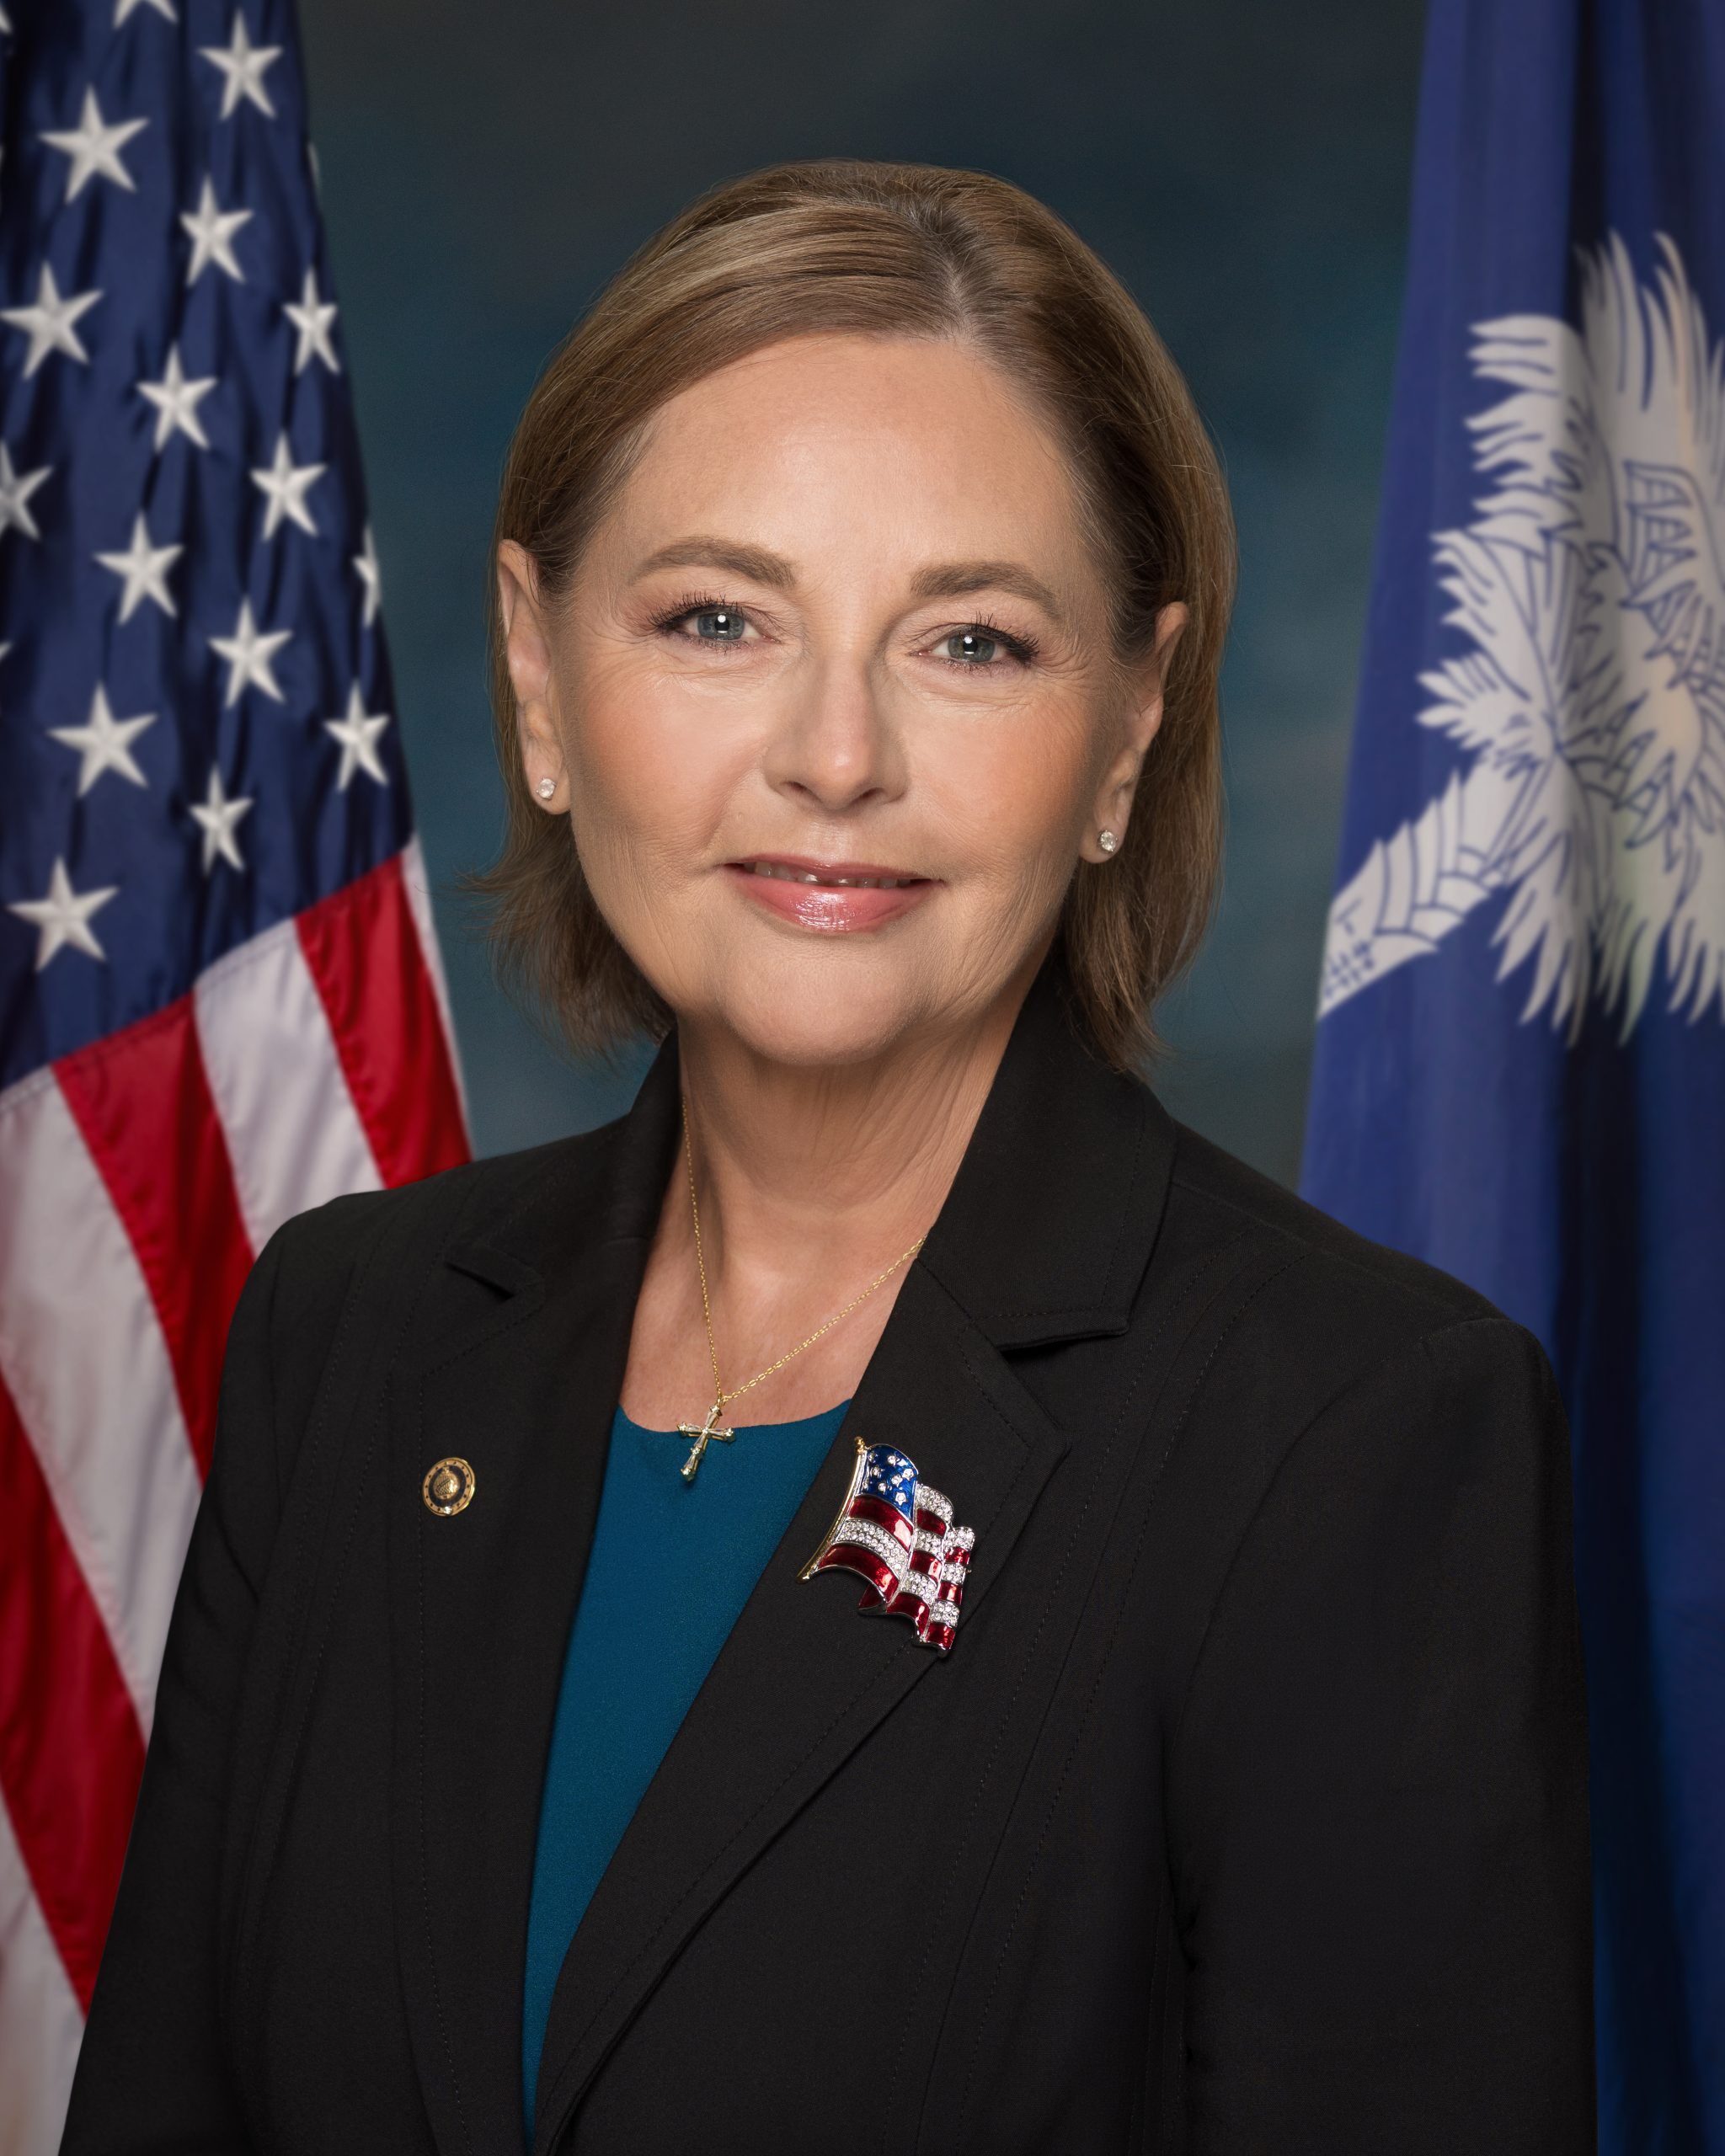 Darline Graham (R)46.0
 James Talarico (D)48.0
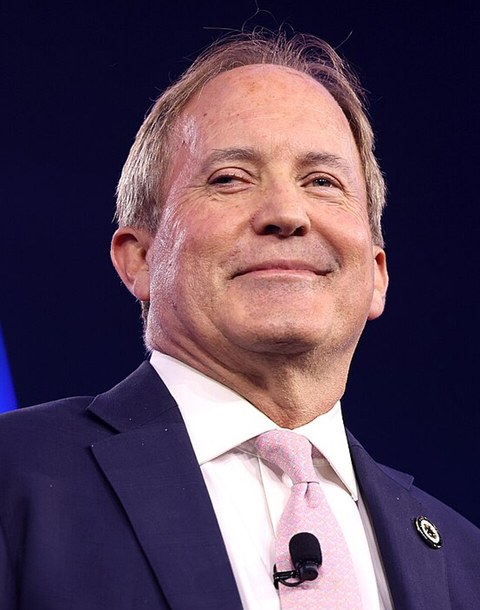 Ken Paxton (R)45.9
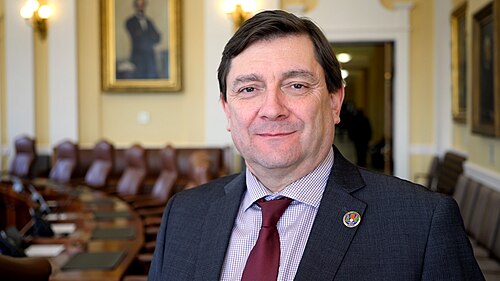 Troy Jackson (D)48.8
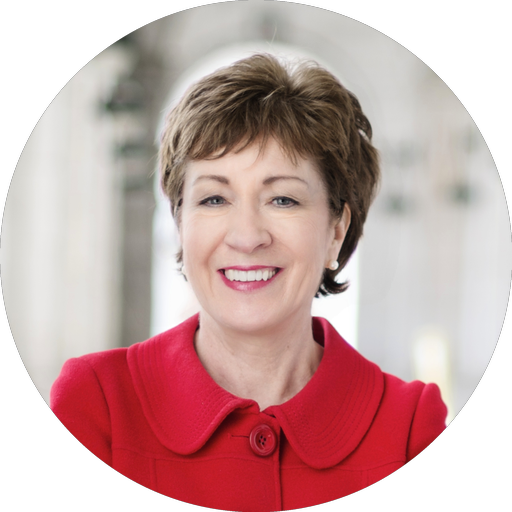 Susan Collins (R)46.5
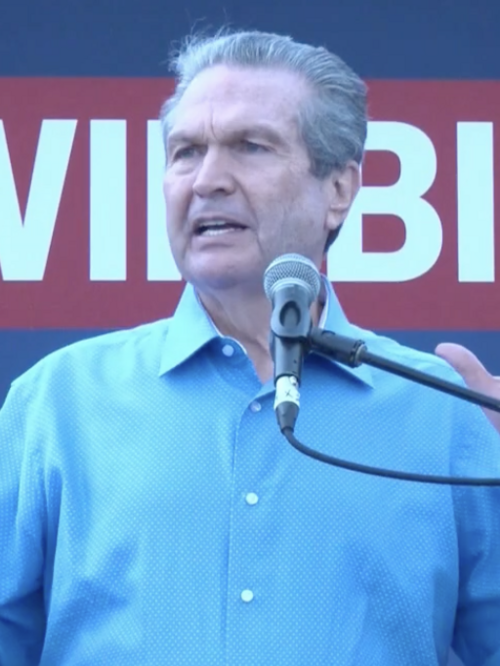 Rick Jackson (R)48.0
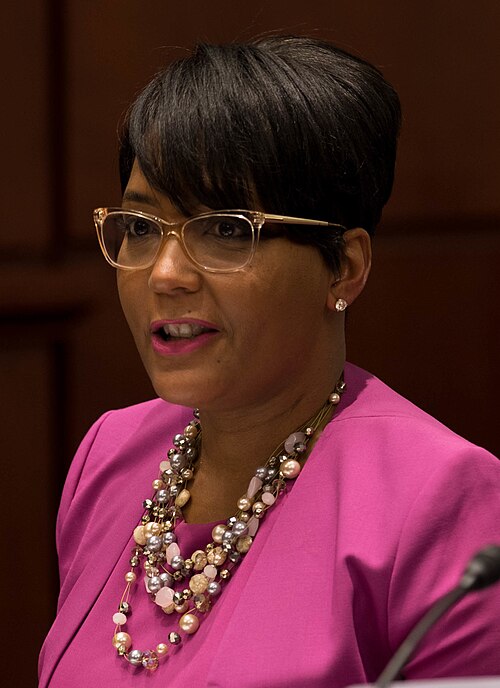 Keisha Lance Bottoms (D)47.6
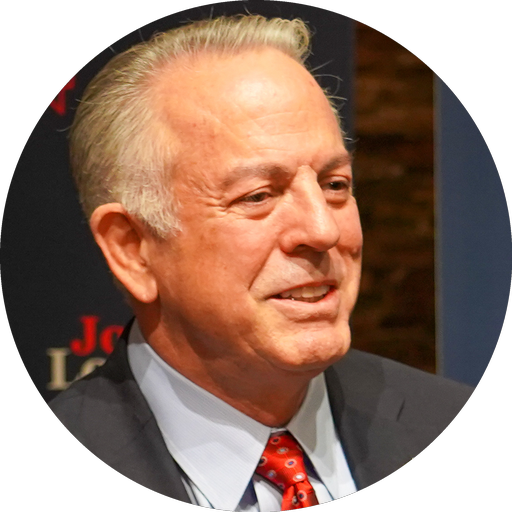 Joe Lombardo (R)40.0
 Tina Kotek (D)46.0
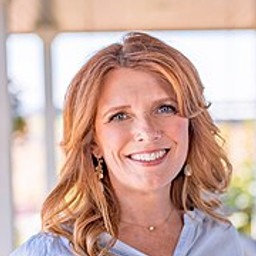 Christine Drazan (R)44.0
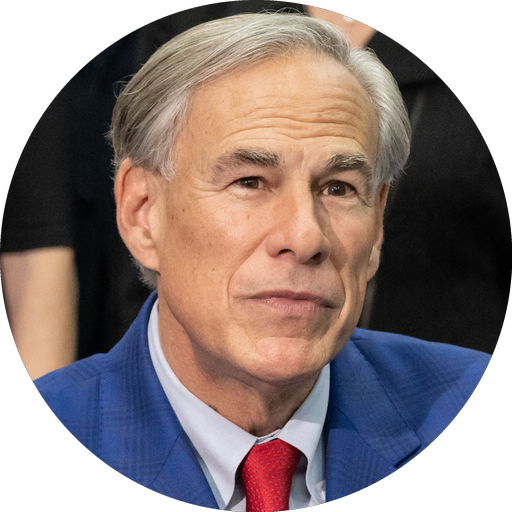 Greg Abbott (R)48.3
 Gina Hinojosa (D)45.8
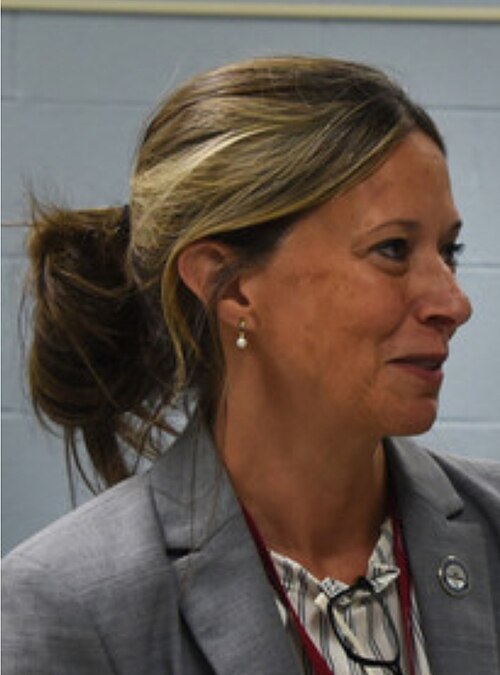 Amy Acton (D)48.6
 Vivek Ramaswamy (R)45.4
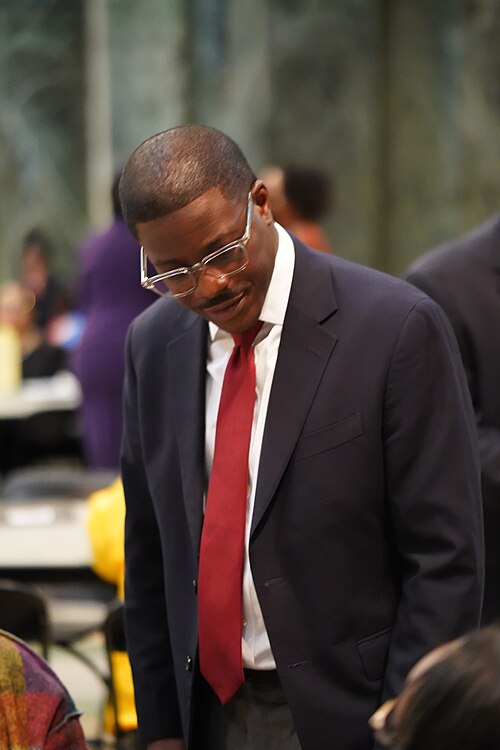 David Crowley (D)47.7
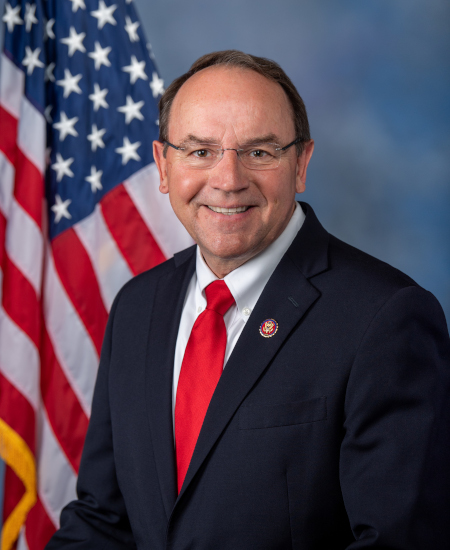 Tom Tiffany (R)44.3
Averages cover the current top-two matchup only, from nonpartisan public polls, latest poll per pollster, equally weighted. Race pages list every poll counted. Sparse local polling means wider error than national averages.
This is an opt-in survey of Baseline readers, not a representative public-opinion poll. It should not be compared with the professional polls above.
The Baseline does not force an equal number of negative verdicts for each party. It applies one published standard to every claim, links primary evidence, labels uncertainty, and keeps reader surveys separate from representative polling.
See the full method → Alaska
 Iowa
Iowa Kansas
 South Carolina
 Texas
Texas Maine
Maine Georgia
 Nevada
 Oregon
 Ohio
Ohio Wisconsin